Data Visualization:
Data visualization is an art of presenting data in a manner that anyone can understand it. Visualizing data is an important part of business analytics. Higher the size of data, higher the need for a data visualization software to help analysts make use of that data.
Data visualization helps in discovering and showing patterns in data to end users. Data visualization aids in conducting and conveying result of data analysis
Tableau:
Tableau is a Business Intelligence tool for visually analysing and presenting data. Users can easily create interactive and shareable dashboards, visualizations which depict trends, plots and graphs that hold insights and in-depth meaning lying in data. Tableau can connect to different types of files, relational and big data resources to acquire and process data. The unique feature of tableau is it allows real-time data collaboration and blending. It is largely used by many businesses, academic researchers, and many government organizations for getting insights from data visually.
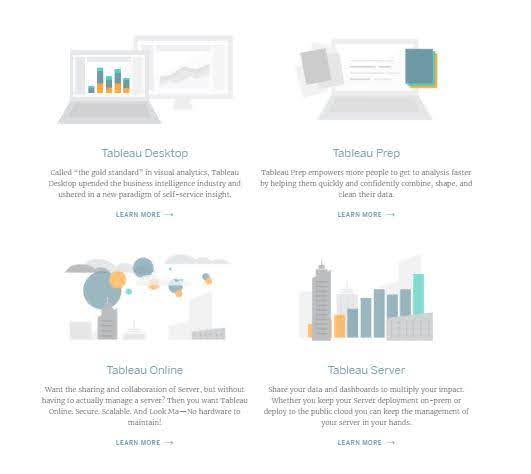
What Products does Tableau offer?

Tableau recently launched new data preparation tool called Tableau Prep which makes Tableau powerful in data wrangling.

Installation:
To work on Tableau, you need Tableau right?
Out of the above five products, Tableau Desktop, Public and Online offer Data Visual Creation.
Tableau Desktop
It is available in the following three formats:
- Free trial for 14 days
- If you are a student or a teacher, you get free access to the Desktop for a full year.
- Purchase Tableau
Tableau Public
Tableau Public is free of all costs and does not require any licence. But it comes with a limitation that your data and workbooks are made public to all Tableau users.
Tableau Online
Tableau Online is the best option for people who wish to make theirs Workbooks on the Cloud and be able to access them from anywhere.
Let’s see benefits of Tableau!
Benefits of learning Tableau:
- Short learning curve:
Tableau is very easy to learn. It’s very interesting tool that you can learn it in a go. Tableau provides free of cost tutorials and articles which helps beginners to easily understand and use tableau to its most. Check out tableau tutorials from here. Using these videos we can know the main features of tableau very easily. We would be able to make dashboards like below with the help of these videos.

- Quickly and easily create interactive plots:
Tableau provides ease to its users in creating interactive plots very easily by using drag and drop functionality. Tableau helps us create a huge array of visualizations, a few of which are mentioned below:
We can create interactive plots which satisfies every unique business problem the props up due to increase in size of data.
 Related Articles: Understanding the Differences Between Business and Data Analytics
- Build interactive dashboards with a GUI:
We can build interactive dashboards to empower clients. In data visualization presenting data is very important aspect, with the help of tableau we can make it possible in a very easy way. We can make interactive dashboards with stunning GUI which can be deployed at enterprise level which can be accessed on laptop, tablet and mobile phones. It makes users to easily understand the data from anywhere.

- Connects to different statistical tools like R:
Tableau provides option to perform basic calculations and simple statistics easily with the help of algorithms present in it. If you want to analyse large data sets and apply statistical models you need to use statistical software like R. After applying different models on data present if you need to visualize the outcome we can get data from R directly into Tableau using a package called Rserve. This helps you to harness the power of data analytics and data visualization for a greater end result.
- Growth:
Tableau adoption is growing in industries day by day and it is named as leader in magic quadrant for business intelligence and analytics platform report by Gartner.

Due to its easiness in learning and simple drag-drop options tableau is becoming the best option from beginners to industry experts. Tableau community is growing day by day at a rapid pace. Meanwhile, Tableau is also increasing its options and features through tools like Tableau Prep and adding latest features in its new versions of Tableau Desktop and Online.
- Pricing:
Tableau is growing day by day not only due to its features but also due to its reasonable pricing. It is becoming a necessary option for data visualization from data science enthusiasts to industry level experts.

Tableau provides license for 70 $ per month and for more details, look into pricing for individual and enterprises (click here). Tableau provides free version called Tableau public which can be used by anyone without paying a single penny. Tableau also provides free license up to 1 year for students and academic persons.
Conclusion:
With its growing demand and features tableau is becoming part of every data analytics industry. It is becoming a must include software tool in a data analyst’s resume. Many industries are adopting it. Leverage the power of data visualization by learning Tableau. Keep practicing to be successful.
Unlock unparalleled data insights with Perceptive Analytics, the leading provider of Tableau consultant services in the United States. Elevate your analytics with our expert guidance and transform raw data into actionable intelligence.


